
In the world of mathematics there is a limitless supply of patterns, visualizations, and concepts just waiting to be explored
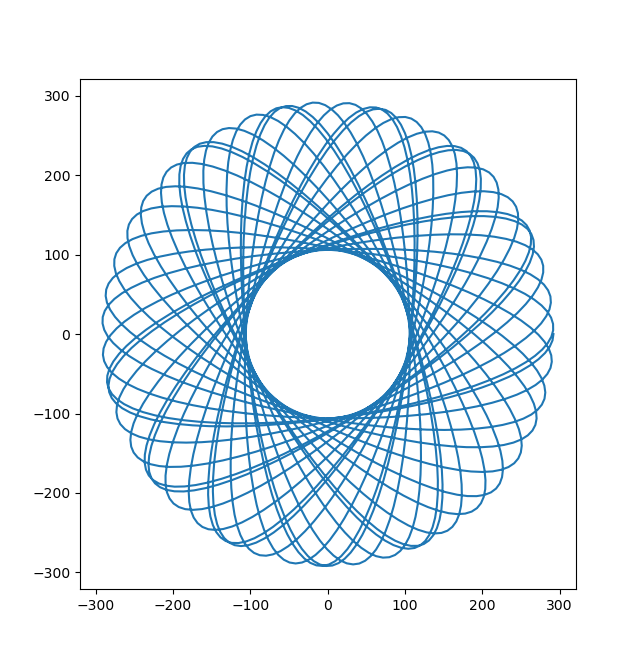
A particularly interesting set of concepts are known as hypotrochoids and epitrochoids - beautiful patterns traced by a point extending from a circle rolling around another fixed circle
![]()
Let’s dive in and explore how spyrograph helps us analyze and explore these interesting mathematical concepts in just a few lines of code!
What are hypotrochoids and epitrochoids?
Simply put, hypotrochoids and epitrochoids are curves formed by tracing a point extending from the center of a circle as it rolls around the inside (for a hypotrochoid) or the outside (for an epitrochoid) of a fixed circle
The resulting curves can be incredibly intricate, elegant, and pleasing to the eye and have a surprisingly wide range of applications ranging from engineering and astronomy to even patterns printed on banknotes and passports as security measures against counterfeiting
Exploring the math behind these patterns
Hypotrochoids and epitrochoids can be broken down to a few key inputs and a set of parametric equations
The inputs are:
- \(R\): the radius of the fixed circle
- \(r\): the radius of the rolling circle
- \(d\): the distance from the interior of the rolling circle
- \(\theta\): the angle formed by the horizontal and the center of the rolling circle
with the parametric equations defined as:
Hypotrochoid
\(x(\theta) = (R - r)cos\theta + d cos(\frac{R - r}{r}\theta)\) \(y(\theta) = (R - r)sin\theta - d sin(\frac{R - r}{r}\theta)\)
Epitrochoid
\(x(\theta) = (R + r)cos\theta - d cos(\frac{R + r}{r}\theta)\) \(y(\theta) = (R + r)sin\theta - d sin(\frac{R + r}{r}\theta)\)
Given this information, we can draw our curves using the output \((x,y)\) coordinates calculated by the parametric equations
Installing spyrograph
Getting spyrograph installed and ready to go is as easy as installing the latest stable release from PyPI or cloning the development version from the official GitHub repo
PyPI
pip3 install spyrograph
GitHub
git clone https://github.com/chris-greening/spyrograph.git
No additional configurations or third-party libraries necessary to get started; spyrograph leverages the Python standard library with optional support for pandas and matplotlib
Using spyrograph for effortless modeling
The purpose of spyrograph is to take the parametric equations and build them into an expressive, easy-to-use set of tools for quickly modelling, exploring, and visualizing the behavior of these curves in Python
from spyrograph import Hypotrochoid
import numpy as np

hypotrochoid = Hypotrochoid(
    R=423,
    r=203,
    d=101,
    thetas=np.arange(0, 720, .1)
)
hypotrochoid.trace()
With just our input parameters and a couple lines of code, we can get on our way tracing our curves and generating stunning visualizations letting spyrograph abstract away the underlying math and implementation details
On top of hypotrochoids and epitrochoids, we also define special cases of these curves such as the
HypocycloidEpicycloidDeltoid- and the
Astroid
for explicit, object-oriented models that are clean, flexible, and ready for programming against
Conclusion
And just like that we can draw beautiful, complex patterns and shapes letting spyrograph deal with all the math and visualization boilerplate
Just plug-and-play your parameters and start exploring the beautifiul world of math!