
Configuring the trace method to explore stunning spirographs in Python
Introduction
Hypotrochoids and epitrochoids are fascinating mathematical curves that create beautiful, mesmerizing patterns
The spyrograph Python package, built on top of the turtle library, provides an easy-to-use interface for visualizing these captivating curves
In this blog post we’ll explore how we can customize the trace method to create our own highly configurable generative art pieces
Getting started
To begin, we’ll need to install the spyrograph package. You can do this by running the following command:
pip3 install spyrographOnce you have the package installed, let’s import the Hypotrochoid class to trace our shape:
from spyrograph import HypotrochoidUsing the trace method
The trace method is one of the centerpieces of the spyrograph package, allowing users to draw beautiful hypotrochoids and epitrochoids with ease
The method comes with a variety of customization options, enabling users to create unique patterns suited to their usecase
Here’s a simple example to get us started:
import numpy as np

# Instantiate our hypotrochoid
thetas = np.arange(0, 2 * np.pi, 0.05)
hypotrochoid = Hypotrochoid(R=200, r=50, d=50, thetas=thetas)

# Draw the hypotrochoid using the trace method
hypotrochoid.trace(exit_on_click=True)
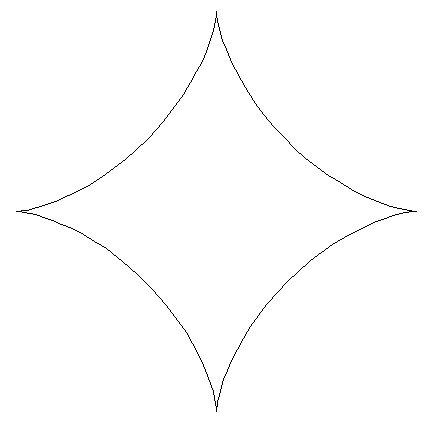
This code snippet will create a hypotrochoid with the specified parameters and trace it on the turtle screen
You can experiment with different values for R, r, d, and thetas to create a wide variety of patterns and shapes
Customizing the visualization
The trace method offers a wide range of customization options to suit our usecase as needed
Here’s an example of how to modify various aspects of the visualization:
hypotrochoid.trace(
    screen_size=(800, 800),
    screen_color="black",
    color="red",
    show_circles=True,
    show_full_path=True,
    full_path_color="grey",
    circle_color="white",
    frame_pause=0.01,
    repeat=True,
    exit_on_click=True
)
In this example, we have:
- Set the screen size to 800x800 pixels
- Changed the background color to black
- Used red as the color of the primary tracing
- Displayed the inner and outer circles that compose the trace
- Show the full path that will be traced
- Set the color of the pre-drawn path to grey
- Set the color of the circles to white
- Added a 0.01 second pause for each frame
- Set the animation to repeat infinitely
Conclusion
The spyrograph Python package empowers users to create and customize mesmerizing hypotrochoids and epitrochoids with just a few lines of code
By leveraging the trace method and its customization options, we can easily generate an array of captivating patterns and stunning art pieces