
Plotting beautiful spirographs with matplotlib and spyrograph
In this blog post, we’ll be exploring the plot method of the Hypotrochoid class in the spyrograph library
This method allows users to create beautiful visualizations of hypotrochoids and epitrochoids using the popular matplotlib library
We will walk through the process of creating a hypotrochoid and then use the plot method to visualize it
Prerequisite imports
Before we dive into creating and plotting a hypotrochoid, let’s make sure we have spyrograph and matplotlib installed
pip3 install spyrograph matplotlibCreating a hypotrochoid
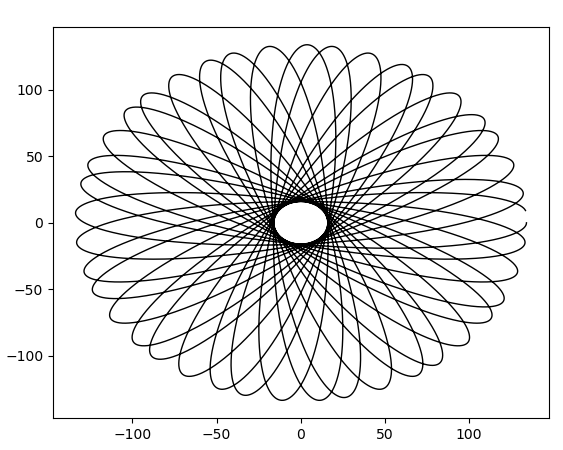
To create a hypotrochoid, we need to specify the parameters R (radius of the fixed circle), r (radius of the rolling circle), d (distance from the rolling circle), and thetas (a list of theta values)
Here’s an example of creating a hypotrochoid:
from spyrograph import Hypotrochoid

hypotrochoid = Hypotrochoid(
    R=100,
    r=51,
    d=75,
    thetas=np.arange(0, 20 * np.pi, 0.01)
)
Plotting the hypotrochoid
Now that we have our hypotrochoid, we can use the plot method to visualize it
This method will return a matplotlib figure and axis objects, which we can further customize if desired
fig, ax = hypotrochoid.plot(
    color="red",
    linewidth=2
)
plt.show()
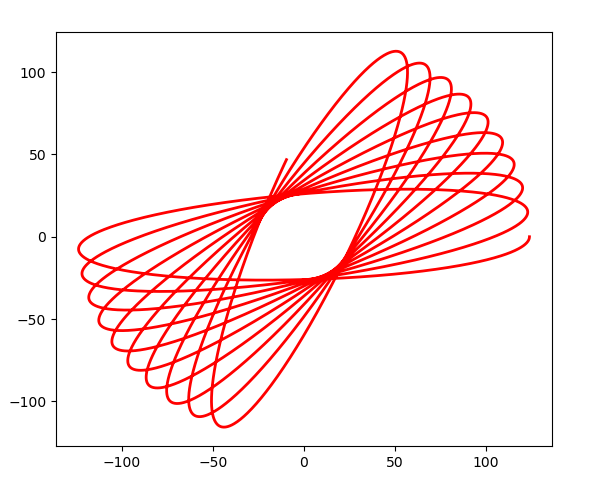
In this example, we’ve specified the color of the hypotrochoid to be blue and the line width to be 1
You can customize the appearance of the plot by passing additional keyword arguments that are accepted by the matplotlib.pyplot.plot function
Conclusion
The plot method in the spyrograph library makes it incredibly easy to create visually appealing plots of hypotrochoids and epitrochoids
With just a few lines of code, we can create stunning spirograph patterns that can be used for artistic, educational, or scientific purposes
Start experimenting with different parameter values and see what amazing designs you can create!